Can MHD turbulence make dust maps good enough to train a CNN?
The goal is a CNN that removes Galactic dust from CMB polarization maps, trained on simulations instead of on the sky itself. This report covers the upstream half: which simulations reproduce the published dust statistics, which ones actually resemble real dust, and what resolution the training maps need.
Status. The simulation and analysis chain is complete; the CNN is not trained yet, because the training set needs simulations that did not fit in the compute available. A second agent (Codex) reviewed this work and found two blocking defects in the analysis. Both are fixed, the affected results were regenerated, and one headline claim did not survive — it is marked where it appeared, and the last section says what the review changed.
The paper's Table 1, reproduced with an independent code
finding 1
The paper fits every spectral slope as α = a + b·MS + c·MA. We repeated that fit on 100 snapshots streamed from The Well's 256³ boxes, which use the Cho–Lazarian ENO code — unrelated to the paper's Enzo — over its sub-Alfvénic family (MA ≈ 0.8, MS from 0.5 to 8.4).
| slope | a (this work) | a (paper) | b (this work) | b (paper) |
|---|---|---|---|---|
| αρ | −3.47 | −3.61 | 0.152 | 0.160 |
| αv | −3.85 | −3.75 | 0.010 | 0.020 |
| αH | −3.57 | −3.53 | 0.031 | 0.020 |
| αTT | −3.64 | −3.59 | 0.174 | 0.150 |
| αEE | −3.38 | −3.41 | 0.164 | 0.170 |
| αBB | −3.93 | −4.31 | 0.216 | 0.280 |
what this buys us
Everything matches except B-modes, and our own from-scratch solver misses in the same direction. Two independent codes disagreeing with the published B-mode fit the same way points at the B-mode measurement rather than at either code. The velocity spectrum goes the other way: The Well gives αv = −3.85 to −4.03 against the paper's −3.86, while our solver gives −3.41 — that slope is our solver's own numerical dissipation.
Do simulated maps look like real dust?
finding 2 — revised after review
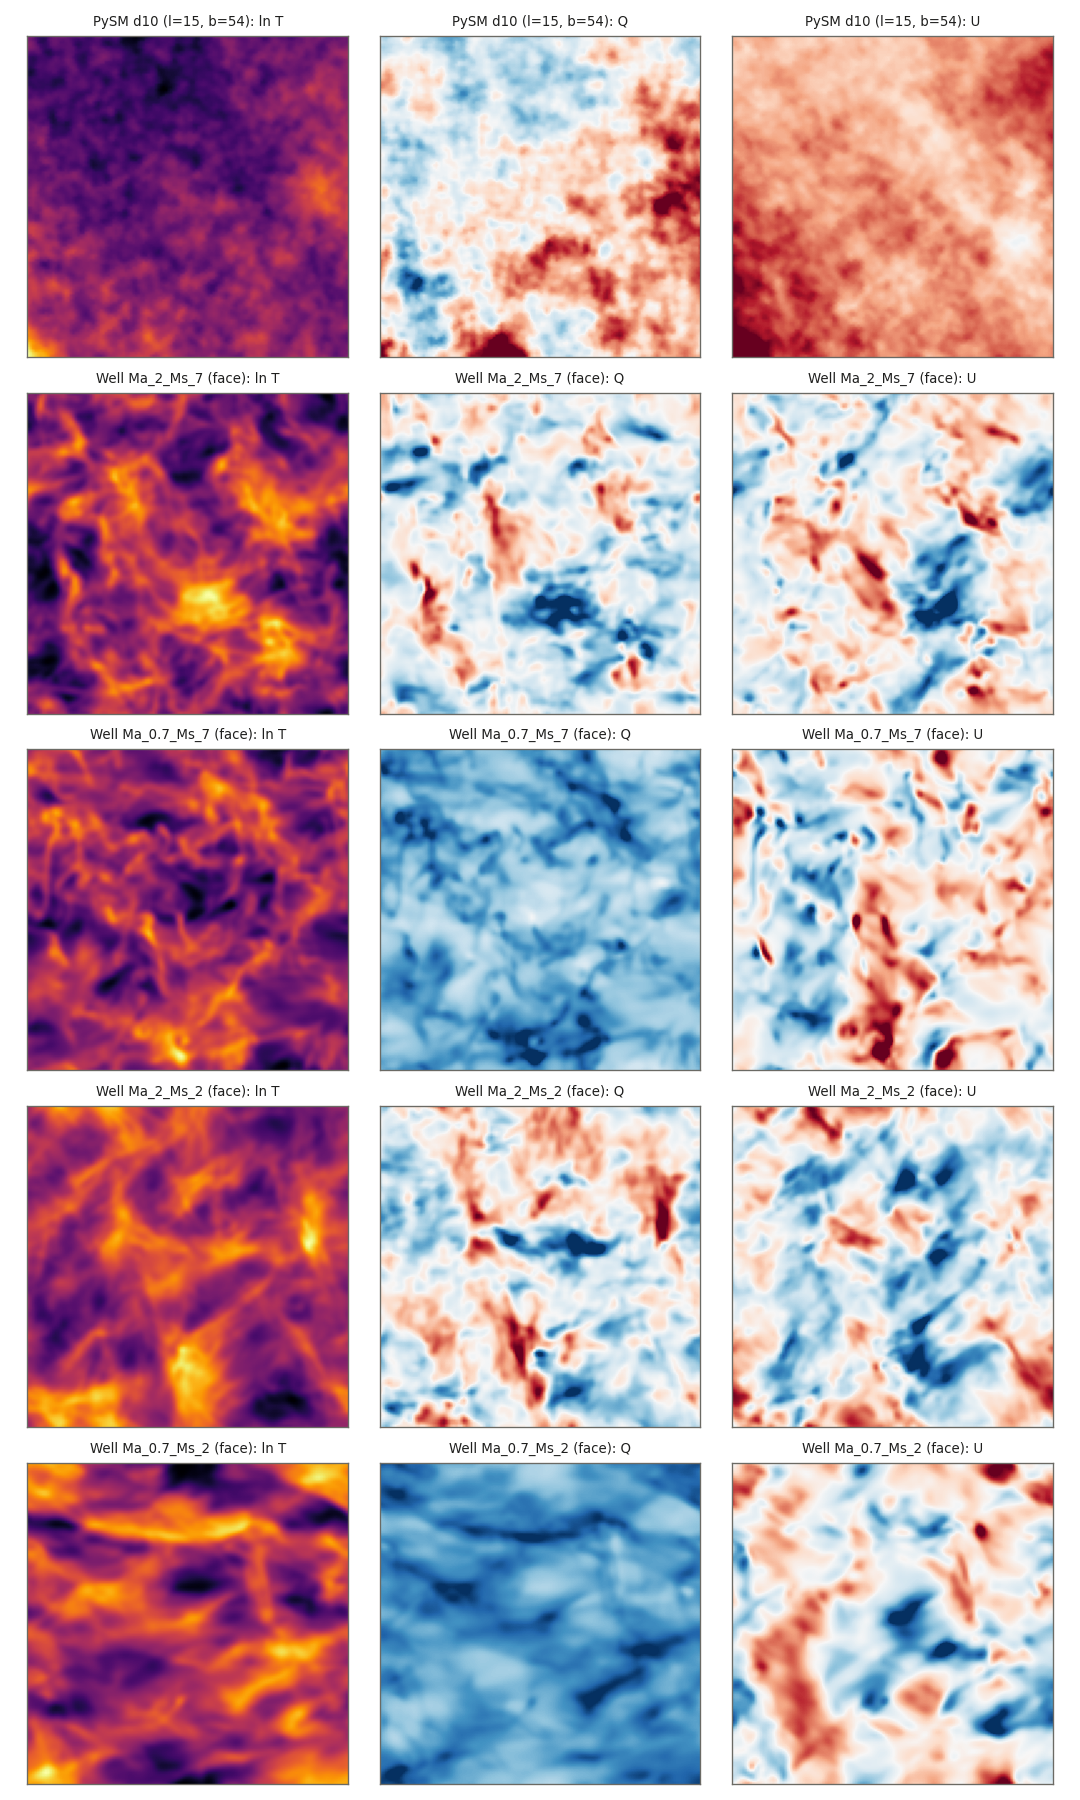
One estimator, applied identically to simulated maps and to PySM3 dust models at 353 GHz (128×128 patches of 20°, Galactic latitudes 35°–75°, E/B decomposed on the full sphere so nothing leaks at the patch edge, same beam divided out of every spectrum). Simulated maps are whole projected faces binned to 128×128, so that a map wavenumber is a box wavenumber, and the band is k = 3–9 — the range where a 256³ box is still turbulent rather than numerically damped.
| source | αEE | αBB | BB/EE | rTE | S at 2 px | p/p₀ | skew ln T |
|---|---|---|---|---|---|---|---|
| PySM3 d1 | −2.78 | −2.70 | 0.56 | 0.17 | 5.6° | 0.09 | 0.27 |
| PySM3 d10 | −2.81 | −2.68 | 0.58 | 0.29 | 4.6° | 0.04 | 0.55 |
| PySM3 d12 | −2.85 | −3.04 | 0.61 | 0.30 | 3.3° | 0.06 | 0.61 |
| Enzo — MS 5.3, MA 1.5 (1 snapshot) | −2.01 | −2.44 | 1.10 | −0.29 | 7.7° | 0.35 | −0.11 |
| Well — MS 7, MA ≈ 8 | −1.90 | −2.56 | 0.96 | 0.51 | 11.7° | 0.17 | −0.06 |
| Well — MS 7, MA ≈ 0.8 | −1.92 | −2.35 | 1.17 | 0.08 | 2.5° | 0.74 | 0.09 |
| Well — MS 2.5, MA ≈ 8 | −2.26 | −3.18 | 0.97 | 0.55 | 9.9° | 0.16 | 0.01 |
| Well — MS 2.5, MA ≈ 0.8 | −2.32 | −3.09 | 1.25 | 0.21 | 1.7° | 0.73 | −0.04 |
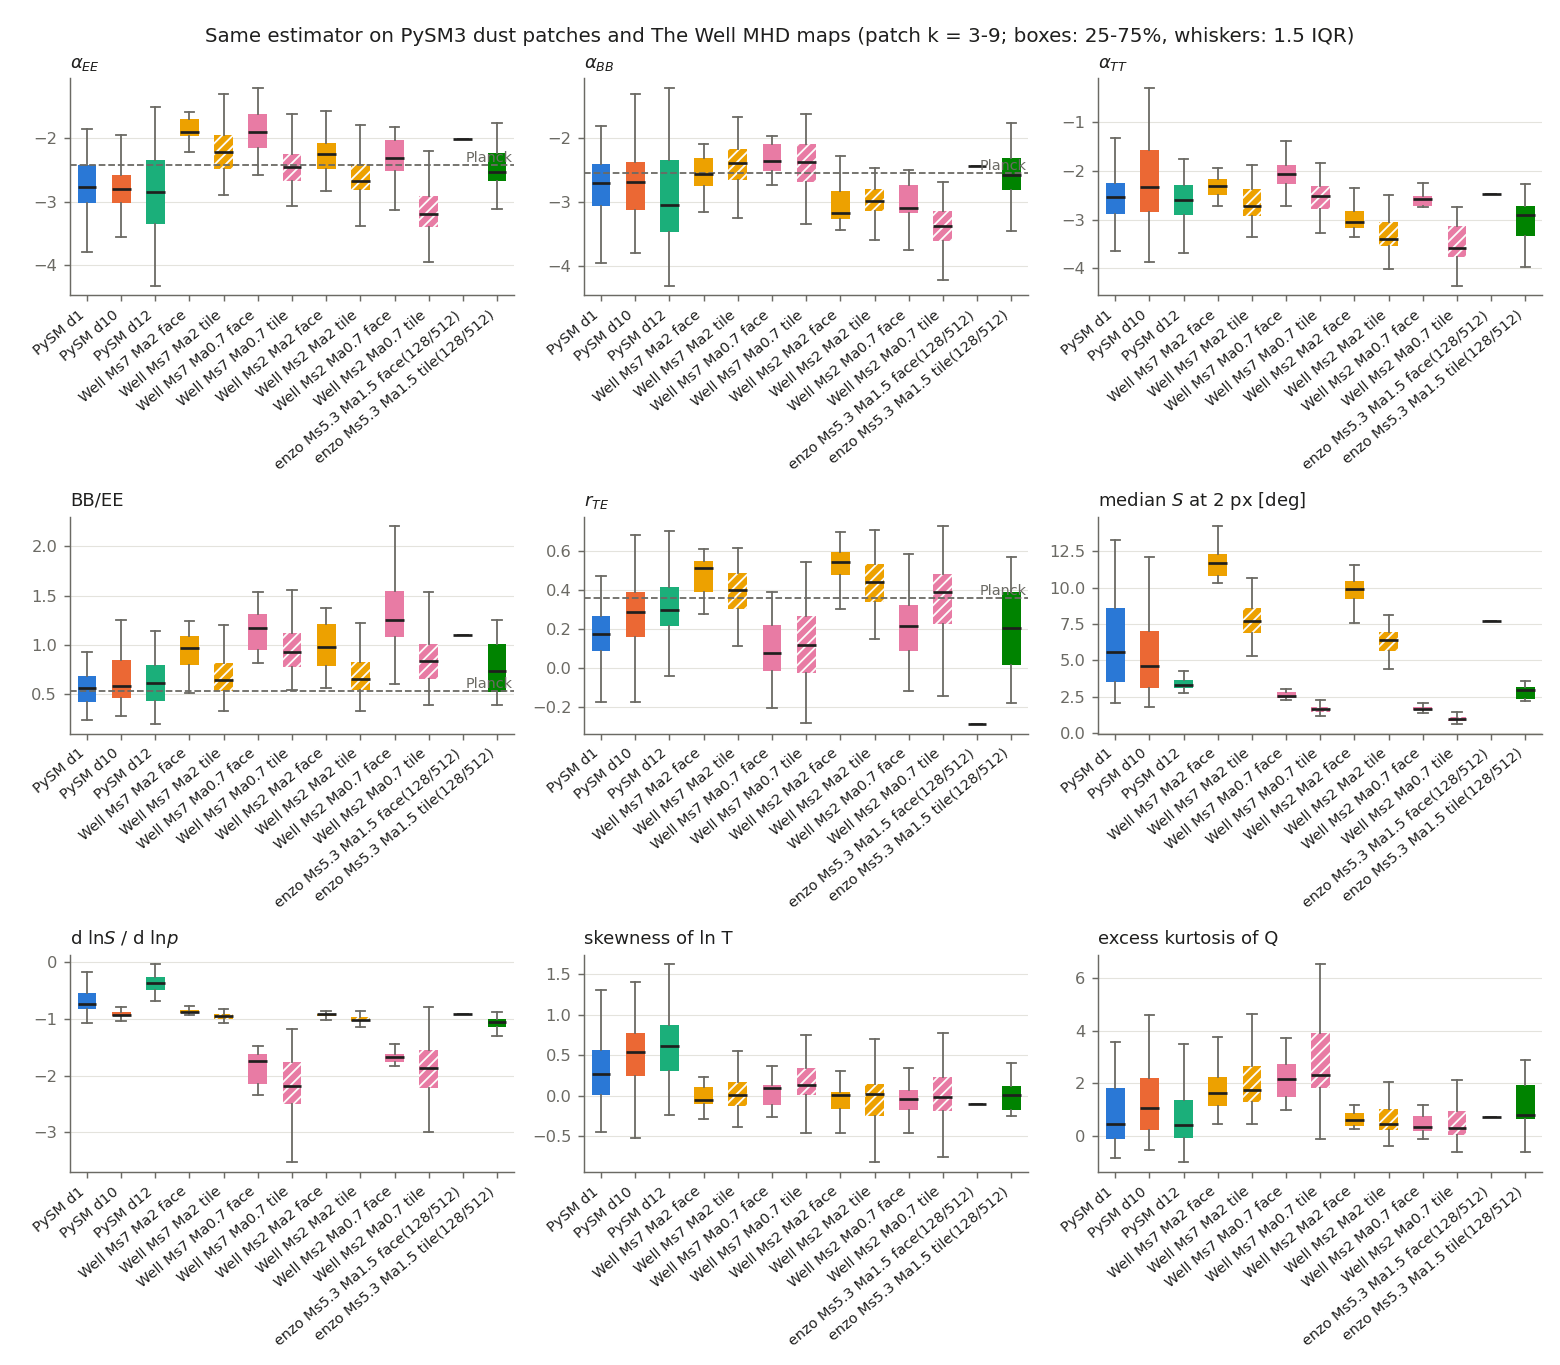
| statistic | the three dust models differ by | simulations sit away by |
|---|---|---|
| αEE | 0.2 | 1.4 – 2.6 |
| αBB | 0.7 | 0.2 – 1.0 |
| BB/EE | 0.2 | 1.4 – 2.5 |
| rTE | 0.8 | 0.5 – 3.7 |
| S | 0.7 | 0.6 – 2.2 |
the honest result
The spectral shapes are reasonable; the E/B asymmetry is not. B-mode slopes land inside the patch-to-patch scatter of the dust models, and so does the angle dispersion for some parameter choices — map by map nobody could tell those apart. What is systematic is that E-mode slopes are too shallow by 0.5–0.9, and that BB/EE is ≈ 1.0 where the dust models sit at ≈ 0.58 and Planck measures 0.53. The sky's 2:1 excess of E over B is the most studied feature of dust polarization and the subject of the paper this project set out to reproduce; a box with BB/EE ≈ 1 has none of it, so a network trained on these maps would learn a foreground with about 70% too much B relative to E — an error in exactly the channel the experiment cares about.
A claim withdrawn. The first version of this report said the Enzo box at MA = 1.5 matched PySM3 on nearly every statistic. That was an artifact. Those numbers came from native-resolution 128² tiles cut from the 512³ face, which sample box wavenumbers 12–52 — mostly the numerically damped range, where slopes steepen and happened to land near the dust values. The reviewer found the inverted conversion; measured on the properly binned face, the same snapshot gives the row above.
Why one 512³ box cost more than the rest of the project
finding 3
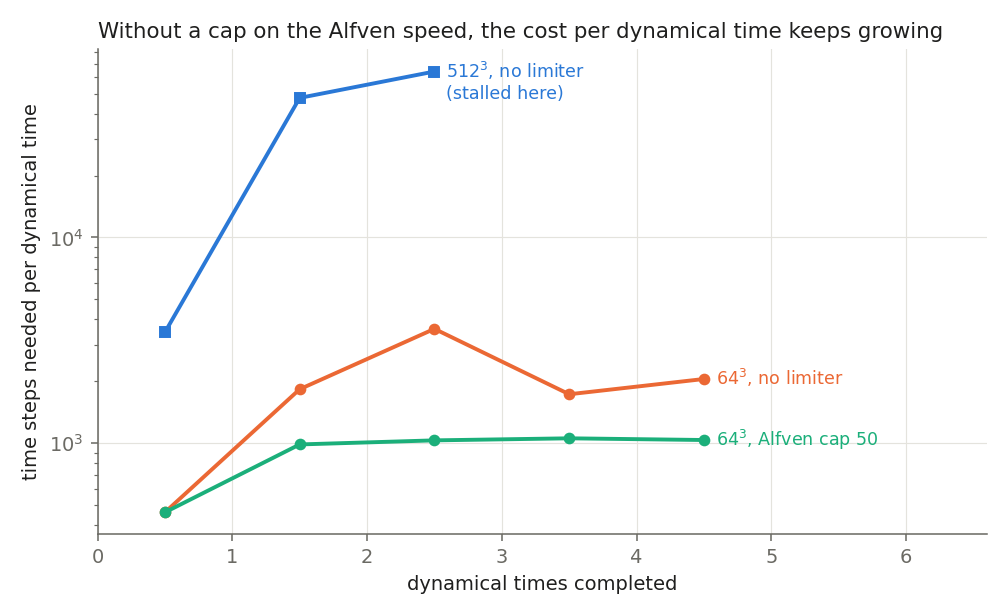
We ran Enzo at 512³ at the paper's Planck point on one 112-core node. Parallel efficiency was never the problem: 2.8×10⁵ cell-updates per core per second, 62% of the wall time inside the MHD solver, load imbalance 1.04. The time step was.
| dynamical times | time steps needed | fastest signal in the box |
|---|---|---|
| 0 → 1 | 3,458 | 29 |
| 1 → 2 | 47,672 | 250 |
| 2 → 2.13 | 64,051 | 900 |
| → 2.44 | 131,684 | 2,295 |
The gas itself moves at about 5. The runaway comes from a handful of cells that the turbulence empties to a millionth of the mean density: their magnetic signal speed B/√ρ sets the time step for the whole box, and those cells carry a millionth of the mass and none of the dust emission. Two three-day segments — about 16,000 core-hours — reached 2.44 of the 10 dynamical times requested.
The fix, and the test that it changes nothing
Enzo has an Alfvén-speed limiter that raises the density of exactly those cells
until their signal speed reaches a cap. Two details are not in the documentation
and came from reading the source: the parameter usually recommended for this
(SmallRho) is not a general floor for this solver, and the limiter
prints one line per capped cell per step, which at 256³ means gigabytes of log. A
one-line patch silences it.
The limiter was then tested rather than assumed: two 64³ runs with identical parameters and forcing seed, one capped and one not.
| quantity | no limiter | Alfvén cap 50 |
|---|---|---|
| cycles for 5 tdyn | 9,665 | 4,571 |
| MS | 4.66 ± 0.25 | 4.80 ± 0.26 |
| MA | 1.44 ± 0.06 | 1.49 ± 0.07 |
| σ(ln ρ) | 1.31 ± 0.05 | 1.34 ± 0.09 |
| αEE | −2.38 ± 0.40 | −2.02 ± 0.35 |
| BB/EE | 1.11 ± 0.23 | 0.89 ± 0.24 |
| αv | −3.90 ± 0.28 | −4.01 ± 0.18 |
| mass added | — | 1.2 × 10⁻⁴ |
The two runs are identical to four decimals until the limiter first fires, then drift apart as any two turbulence runs do after a tiny perturbation, so the comparison has to be statistical: no quantity differs by more than its scatter between snapshots. Treating the seven dumps as independent, the 95% intervals on the differences are about [−0.10, +0.84] for αEE and [−0.52, +0.08] for BB/EE — the test excludes a large effect and nothing finer, from one seed at 64³. The cost reduction, by contrast, is measured directly.
cost after the fix
10 dynamical times take about 4 days and 10,000 core-hours at 512³, or about 8 hours and 900 core-hours at 256³. Before the fix, the 512³ box was heading for 40,000–70,000 core-hours with no end in sight.
Is 256³ enough to train the CNN?
finding 4
Three measurements on real 256³ data decide this.
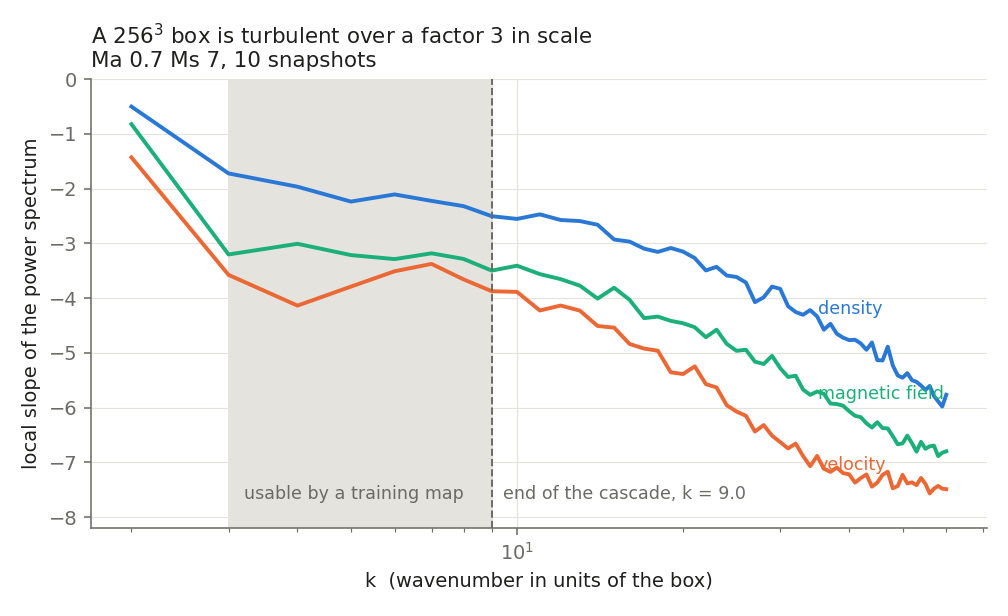
Where the turbulence stops being physical
The local slope of the power spectrum is flat through the cascade and steepens where the scheme's numerical dissipation takes over. That knee sits at k ≈ 9 in a 256³ box: physical over a factor of 3 in scale. How far it sits depends on the criterion — between 7 and 14 as the reference window and tolerance are varied — and that spread is part of the result. The common assumption that the knee scales with resolution is not supported by our own ladder: the same criterion gives k ≈ 8 at 64³ and k ≈ 9 at 128³.
What a 128×128 map keeps
Binning a 256² projected face down to 128² costs almost nothing. Cutting a native-resolution quarter tile instead is a mistake, and the reason is the one the review corrected: a half-width tile reaches a given box wavenumber at half its own k, so its band sits at smaller scales, past the knee. Its slopes are steeper by 0.4–0.9 because they are measuring numerical dissipation.
| map product | αTT | αEE | αBB | BB/EE | rTE |
|---|---|---|---|---|---|
| native 256² face | −2.52 | −2.09 | −2.71 | 1.08 | 0.36 |
| 128² binned face | −2.54 | −2.10 | −2.73 | 1.07 | 0.36 |
| 128² native tile | −2.99 | −2.62 | −2.78 | 0.77 | 0.35 |
What the same band means on the sky
| map size | ℓ at k = 3 | ℓ at k = 9 | pixel |
|---|---|---|---|
| 20° | 54 | 162 | 9.4′ |
| 10° | 108 | 324 | 4.7′ |
| 5° | 216 | 648 | 2.3′ |
Planck measures dust over ℓ ≈ 40–600, a factor of 15 in scale. A 256³ box gives a factor of 3. Whether a bigger box buys range in proportion is exactly the scaling our ladder does not support, so the covered range has to be measured per box rather than assumed.
answer
Pixels are not the limitation; scale range is. Binning to 128×128 costs 0.02 in slope, so the CNN's input resolution is free. But a 256³ box is physical over only a factor of 3 in scale — ℓ ≈ 108–324 for 10° maps — so training maps must be binned full faces with a declared angular size, and the network cannot be asked to learn structure outside that band. At 900 core-hours per box against 10,000 for 512³, more seeds still beat one large box. What this does not show is that such training transfers to the sky: after the revision above, that question now outranks resolution.
What the external review changed
cross-agent review
A second agent (Codex, OpenAI) reviewed the code and the result files, with a prompt requiring every finding to point at a file, a line or a number. It returned ten findings; eight were accepted outright and two in part. Two were blocking:
Wrong frame on one projection axis
For one of the three lines of sight, Q was defined in the cyclic sky frame while the E/B transform used the array's own axes, mixing E and B. Half the simulated maps in two result files were affected. Fixed and verified against the same line of sight rotated onto a different axis, to one part in 10¹⁵.
Inverted scale conversion
A half-width tile reaches a given box wavenumber at twice its own k, not half. Native tiles were therefore measured in the numerically damped range — which is what produced the apparent agreement between the MA = 1.5 box and the dust models.
A knee that could not be found
The dissipation-knee search started above its own reference window, so it could not return a value below 11; five of twelve results sat at exactly that bound. Widened, the knee moved from 12 to 9, with a published sensitivity table.
Claims stronger than the data
"Statistics unchanged" by the Alfvén limiter became a bound (nothing finer than ≈0.8 in a slope is excluded by seven snapshots at 64³), and "only MA ≈ 1.5 matches dust" was withdrawn.
The full exchange — prompt, findings verbatim, and a response to each marked fixed, accepted or disputed — is in review/ in the repository. Two earlier attempts produced no review at all: the reviewer's sandbox could not start, and it reported that as a blocking finding rather than inventing results.
What is left
Finish one 256³ box
At the Planck point with the limiter, about 8 hours on one node. Queued as job 47520681.
Build the training set
Several seeds, snapshots every 2 dynamical times (the measured decorrelation time), binned faces, random rotations: about 1,600 maps for roughly 5 × 900 core-hours — worth doing once the E/B mismatch above is understood, since the network would learn it.
Train and stress-test the CNN
Then test it on PySM3 dust models it never saw during training.
Chase the B-mode excess
Every box measured here, from three codes, carries more B relative to E than the dust models do, and the same excess appears against the paper's value. Estimator, projection model or physics — the next test pushes known pure-E realizations through the whole pipeline.